
Pandas (Python Data Analysis Library) is an open source, BSD-licensed library providing high-performance, easy-to-use data structures and data analysis tools for the Python programming language (Pandas Documentation). It consists of modules that make tabular data manipulation easy. A two-dimensional tabular data is referred to as Pandas Data Frame while a one-dimensional tabular is referred to as Pandas Series.
The codes used in this topic are based on Pandas Getting Started Tutorial article.
Sub Topics:
(1) Creating Dataframe
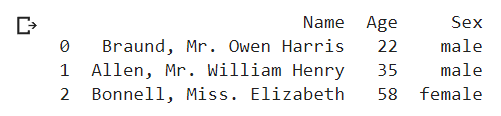
Pandas Data Frame can be created from a Python Dictionary. The keys in a dictionary becomes a column header and the array values for the key becomes the rows for that header.
import pandas as pd
# declare a dataframe
df = pd.DataFrame(
    {
        "Name": [
            "Braund, Mr. Owen Harris",
            "Allen, Mr. William Henry",
            "Bonnell, Miss. Elizabeth",
        ],
        "Age": [22, 35, 58],
        "Sex": ["male", "male", "female"],
    }
)
On the other hand, Pandas Series can be created either from a Python Dictionary or derived from an existing Pandas Data Frame.
import pandas as pd
# (1) declare a series from a dictionary
Ages1 = pd.Series(
    {
        "Age": [22, 35, 58],
    }
)
print(type(Ages1))
print(Ages1)
print("----------------------------------------")
# (2) declare a series from a previously declared dataframe
Ages2 = df["Age"]
print(type(Ages2))
print(Ages2)

Pandas Data Frame and Series can also be created from a Python List. However, the resulting dataframe/series will be missing the column names.
import pandas as pd
# declare a dataframe
df = pd.DataFrame(
    [
    ["Braund, Mr. Owen Harris",22,"male"],
    ["Allen, Mr. William Henry",35,"male"],
    ["Bonnell, Miss. Elizabeth",58,"female"],
    ],
)
print(df)
print("----------------------------------------")
# declare a series
ds = pd.Series(
    [22, 35, 58],
)
print(ds)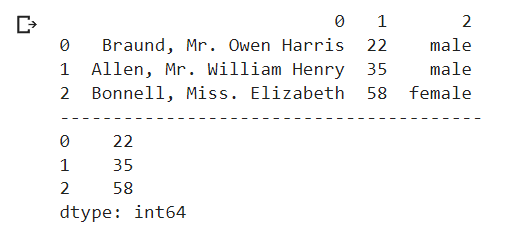
Alternatively, add an additional parameter (columns for dataframe and name for series) that defines the column names in the dataframe/series declaration statement.
import pandas as pd
# declare a dataframe
df = pd.DataFrame(
    [
    ["Braund, Mr. Owen Harris",22,"male"],
    ["Allen, Mr. William Henry",35,"male"],
    ["Bonnell, Miss. Elizabeth",58,"female"],
    ],
    columns=["Name","Age","Sex"]
)
print(df)
print("----------------------------------------")
# declare a series
ds = pd.Series(
    [22, 35, 58],
    name="Name"
)
print(ds)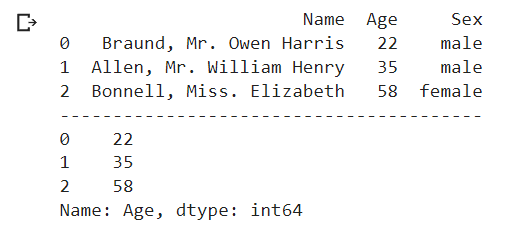
(2) Importing Data into DataFrame
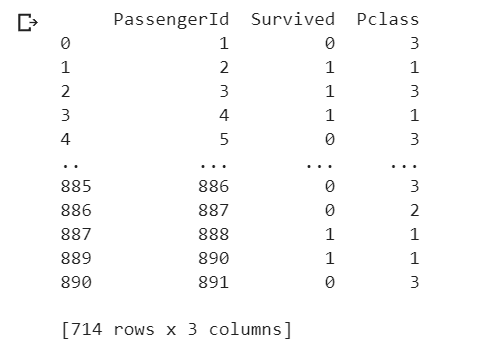
Usually the data source for Data Frame and Series are imported from text files e.g. CSV.
import pandas as pd
# declare a dataframe from a remote file
filepath="https://archive.org/download/misc-dataset/titanic.csv"
df_titanic = pd.read_csv(filepath)
print(type(df_titanic))
print(df_titanic[["PassengerId","Survived","Pclass"]])

Conversely, the Data Frame can be exported back to CSV file. Besides CSV, Data Frame can be exported to several other formats i.e. using methods to_dict(), to_excel(), to_json(), to_numpy() etc. (Read further: How do I read and write tabular data?).
import pandas as pd
# declare a csv targetfilepath
targetfilepathcsv="titanic.csv"
df_titanic.to_csv(targetfilepathcsv)
# declare a csv targetfilepath
targetfilepathxls="titanic.xls"
df_titanic.to_excel(targetfilepathxls)

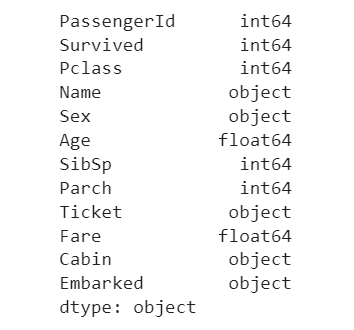
View the data types for each Data Frame columns to understand about their nature.
# get column data types
df_titanic.dtypes
The data types in this DataFrame are integers (int64), floats (float64) and strings (object).
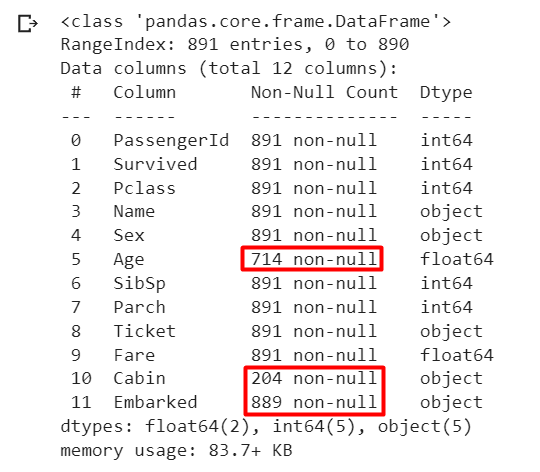
View technical info for the Data Frame to understand more about their complexity, if any. For example, the technical info here indicates that there could be some complexities i.e. some columns do have missing values and less than 891 non-null values.
# get technical info
df_titanic.info()
REMEMBER
- Getting data in to pandas from many different file formats or data sources is supported by read_* functions.
- Exporting data out of pandas is provided by different to_*methods.
- The head/tail/info methods and the dtypes attribute are convenient for a first check.
(3) Handling DataFrame with Missing Values
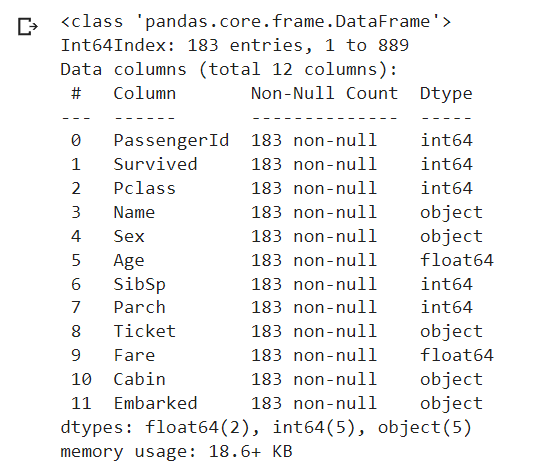
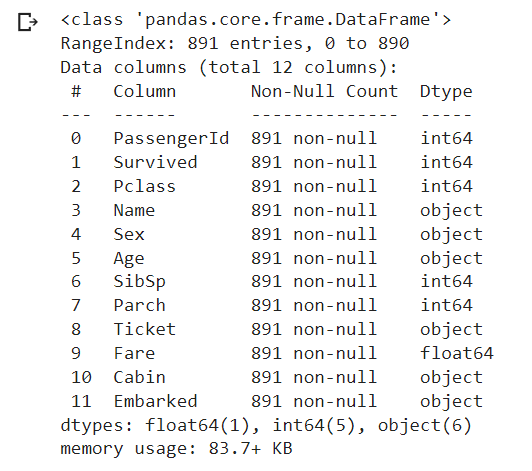
Two ways to handle dataset with missing values (na):
- Drop rows having missing values (final records=183).
- Replace the missing values (final records=891).
import pandas as pd
filepath="https://archive.org/download/misc-dataset/titanic.csv"
df_titanic = pd.read_csv(filepath)
# drop "na" rows
df_titanic.dropna(inplace = True)
df_titanic.info()
import pandas as pd
filepath="https://archive.org/download/misc-dataset/titanic.csv"
df_titanic = pd.read_csv(filepath)
# replace "na" rows
df_titanic.fillna("-",inplace = True)
df_titanic.info()
(4) Filtering Dataframe
Filtering in Pandas Data Frame works similar to the List Comprehension technique.
# assign new data to df_age_no_na
# by filtering df_titanic for age not na
# print selected columns
df_age_no_na = df_titanic[df_titanic["Age"].notna()]
print(df_age_no_na[["PassengerId","Survived","Pclass"]])
(5) Selecting Rows and Columns in DataFrame
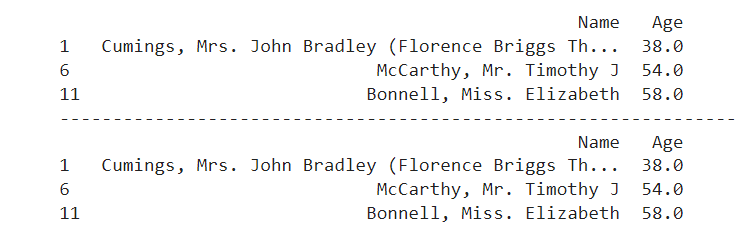
Rows and Columns in DataFrame can be selected using loc and iloc methods. loc selects rows and columns with specific labels while iloc selects rows and columns at specific integer positions.
# filter df using loc
# select row for age > 35
# select column by label "Name","Age"
df_loc_age_gt_35=df_titanic.loc[
    [row for row in df_titanic["Age"] > 35],
    ["Name","Age"]
    ]
print (df_loc_age_gt_35)

print("----------------------------------------------------------------")
# filter df using iloc
# select row by index 1,6,11
# select column by index 3,5
df_iloc_age_gt_35=df_titanic.iloc[
    [1,6,11],
    [3,5]
    ]
print (df_iloc_age_gt_35)
Read further: https://pandas.pydata.org/docs/user_guide/10min.html
![[what] Lambda (Anonymous Function) In Python](https://blogger.googleusercontent.com/img/b/R29vZ2xl/AVvXsEhFcCMnHmDuefUzrRAsSR6u9oQDNYMzJn5mGIM3DcFKwiLkTM1zYLb_ydhamlqwxG94dJFMDG6ioBKkXYB4U4VSei1mKX3D3DZ_ic2Q1woqNM-Zfn1ZZzZygwLo8f-V2S15Fgrtg58DVesegNSBlLjunDWfnmf4c48wBrUIb66gXxoFf-GCmCkB9hdu/w72-h72-p-k-no-nu/lambda-1.jpg)
![[what] SciPy (Scientific Computing in Python)](https://blogger.googleusercontent.com/img/b/R29vZ2xl/AVvXsEga6AJY1_FY6eEacD62tgn-vTle0J3Um2KS32RUfHbFMZ6pqPDZ0I0FI95Cq1zi4iR2R1S5YfvFnquvb4idQity36zVX36YKJsIFYcQDYneZsm7jt5Bg1A5FpGiSph2z7fg1fxLoaZtJqltfvn228XW5r3JdR8jMwZbmFDisq0AG2UYMmhBdDxmYQE1/w72-h72-p-k-no-nu/scipy.jpg)
![[how] Organize Text Data Using Pandas (Python Data Analysis Library)](https://blogger.googleusercontent.com/img/b/R29vZ2xl/AVvXsEju8-3O2Gin-OBBav3EUAQwP6m_7svhPzPgYoPkyzK-pcbPWkZjJtDbNBLUPmRyPiB9aB6lAteLH0VNrvmm1qmqPVkp8DoxMBQCNO6Ho1_fdX-OAv9QYn_xU9OmHKCpqsvqgI7yUlLZwCRgdTtIl76Sw8zhkTgzvnjTAT0zxbEC5_H57R66raT9mY3-/w72-h72-p-k-no-nu/pandas-dataframe.jpg)
![[what] Pandas (Panel Data Analysis) In Python](https://blogger.googleusercontent.com/img/b/R29vZ2xl/AVvXsEgi8Yz3ogVcc0z6P2cf_LA3E4VqesuI9KdNK-yCf_hcLESIjXx4R7_5YrJxfrgLVE1iDfRv2thgSbn5aggVkkRAhUS_kFZHzWDFFrmtxxeO66TKruIDO5JEHfRzID7th801uJYuwJ9GkBhxPhiAk7LCfJh7HGh53YfXsGxVELvTzRIPuYQCl-xDF4-f/w72-h72-p-k-no-nu/panel-data.jpg)

![[how] Connect Colab To Google Sheet](https://blogger.googleusercontent.com/img/b/R29vZ2xl/AVvXsEjOwMYfzIxcAL36yTXWGC3JSykf-LlEZlLgE83aSVYL0AWll6cTQCg-TejFtmzy77kCrOfFWhAMKkAaI5XlfOQa2jrVFrJEa5lVg0-AUuInnoVB-tpy8olM3UFq5U8Etq9j1CbBOp-oopqC9ZXMWaQZDaVFH1uitp8jE5sgqJHlmRYg2HehKcP_v5Kd/s840/keyboard2.jpg)
![[what] Basic Program Control Structures In Python](https://blogger.googleusercontent.com/img/b/R29vZ2xl/AVvXsEgfp5UTw1HRWFs6CvOYl7Rup9YEjBIWYyCPtudMp2IXIKF_N-v_pfj0cesSk6-oDOLQFhOtiP3-V3OdPad38NftngX0MUmWJTXmplySQvE8TcfXqYf_6qMUzzH9S1zINbD2NrYBNNVjMdxEv8URMIrt3s_J31MOjrcJK-DpnrxOK47YzQdcaCe1pxF9/w72-h72-p-k-no-nu/01-hello-world.png)
![[what] Iterables and Iterators In Python](https://blogger.googleusercontent.com/img/b/R29vZ2xl/AVvXsEjalQDpgm5KJqMGVa5bivgzsMGDDx0qNbJ-SUZbxMHdX6Mw8618tzHhRjZvx6HEeYHxr5_XHEsI9wQk4OfqtOmUBVBDEJA5kTlH-KYD-EX7yI5DU1GDfkwaaHzp3SbpcD6RfltrpQ-67mqEZTyLh10ZuRj_PNoH5XwOL8Ji5G3keuPYKLDM4xP2FOkC/w72-h72-p-k-no-nu/iterables-iterators.jpg)
![[what] Python Map, Filter and Reduce Functions](https://blogger.googleusercontent.com/img/b/R29vZ2xl/AVvXsEhxthbUIItcyDXW1GJ6gHRvaUL7LyeA2m7GsBgI0Gb4y-VBcHmcPFkuZPfSxLhrffJwyiWpQqGibQQRhCJM71ir_OLIJ9wB1gs-U-ssiW-xh_gry6A2wHGCRSSfnjedcyGTGDNcQlfnAxZSwVQ4cCIDUHa6iTQRVWaZl8Qbz3B2LAUTFhzQ2Jvmgu4o/w72-h72-p-k-no-nu/map-filter-reduce.jpg)
![[get-started] Python For Beginners](https://blogger.googleusercontent.com/img/b/R29vZ2xl/AVvXsEjmS6FFThm5ApijpmeGWIvjoEAS8yU1HgGQ8gJ8pn19WbJJvVPY7HT1mKwFdKDIyi1WqnNdML9Gg5yzs0ZU8Ql8mskxP9eHYOEJ3qrL9LDjQJvbNXVSJ-fJXBlNpDR4UPeIshr5VE86VRJlSdrwwgm8JtXA3Km1BWALtIBssD4uFsWJhUdFNzh0pvrt/w72-h72-p-k-no-nu/python-getting-started.jpg)
![[what] String Manipulation For Textual Analysis In Python](https://blogger.googleusercontent.com/img/b/R29vZ2xl/AVvXsEjDisGCRILNpLMSBsYRFRQq_0EpovrvFWyBu4klsOiZojkbqJ3w33IggKXayMaEyxglwtKkAoFSMzHUYu4nl2kQvluzuNKrGeJleTPGHaojEDXSzVyl15l9Qlkczup38Bw_0oQ9QkC3IIXpPhM5tIxvlnEMsln85TuGSjvt9q-txTQrZ15_-QrMjSuf/w72-h72-p-k-no-nu/chillax.jpeg)
![[how] Import Text Resources Into Python For Text Processing](https://blogger.googleusercontent.com/img/b/R29vZ2xl/AVvXsEh-NXKWltBB3ZHD3-s9xch9zqcSz18pvCfsbcWAOAIYloe_9A93GCH2wb_8RYcBeUfvMtgJvCfeC7_XYShgoMdWxf-gf1OXlkqpkTTwCzQwISVbxHhvDl1MG0dCarzPZMydJogG_9b_9JEf6ut8ib0lhQO5IxBwOpCunVdVcnvTNzTI5GX-NwA0O5L0/w72-h72-p-k-no-nu/raw-text.jpg)

)
0 Comments